It is well known that some foods have a much more significant impact on emissions than others: this aspect is sometimes called the carbon footprint. In this section we assess the impact of different categories of products on global emissions amounts in agricultural activities.
There is no direct way to exactly compute carbon footprint: these values are usually built up by imputation of total emissions values to the different products, according to various parameters and more general considerations. Since we only have aggregate data, our approach has been to apply instead Machine Leaning techniques (see footnote).
Hereunder, you can find carbon footprint data and a short description for those categories of products which have a significant impact on total emissions related to agriculture.
Beef and Buffalo Meat
- Annual per capita consumption: 9.71 kg
- Carbon footprint: 29.9 CO2 kg
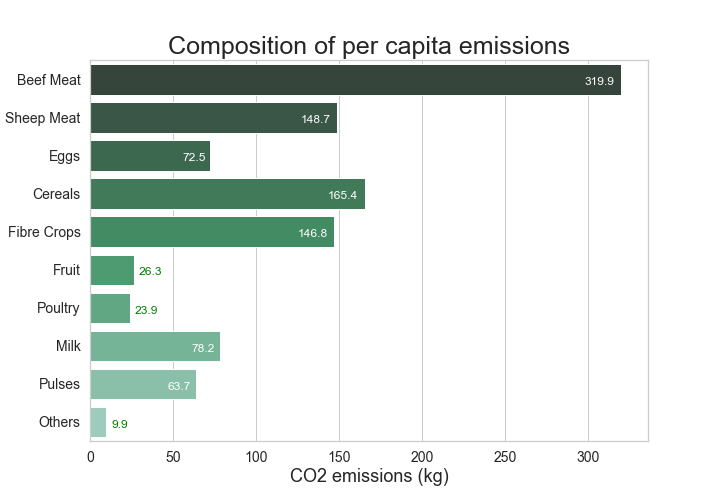
- Total per capita emissions: 320 CO2 kg
Beef (and Buffalo) meat has a relevant carbon footprint, caused both by the feeding and caring of animals and by their production of methane (a potent greenhouse gas). Moreover, beef meat is the second most consumed type of meat (first is poultry) and is eaten all over the world: this make this category the one with the highest per capita emissions.
Australia, New Zealand and South American countries are historically those which produce and export a huge volume of beef meat.
Data below on per capita production are reported in kilograms.
Sheep and Goat Meat
- Annual per capita consumption: 1.93 kg
- Carbon footprint: 77.6 CO2 kg
- Total per capita emissions: 149 CO2 kg
Sheep and Goat meat is by far the category with the highest carbon footprint: it includes lamb meat, which is considered the single product with the larger impact on CO2 emissions. However, their per capita consumption in the world is much lower than beef meat, which result in a lower impact on emissions.
Australia and New Zealand, above all, are the major producers, together with Iceland and Mongolia: harsh climate conditions in these last two countries are unsuitable for breeding larger animals, but are good for sheeps.
Data below on per capita production are reported in kilograms.
Eggs
- Annual per capita consumption: 9.44 kg
- Carbon footprint: 9.37 CO2 kg
- Total per capita emissions: 72.5 CO2 kg
Eggs are the best source of protein as for carbon footprint: most of the emissions related to eggs come from energy use in farms.
Netherlands and Israel are the countries which produce the highest amount of eggs per capita: while Israel was leader in the 1960s, their roles have recently reversed, with Netherlands being by far the top producer.
Data below on per capita production are reported in kilograms.
Cereals
- Annual per capita consumption: 357 kg
- Carbon footprint: 0.452 CO2 kg
- Total per capita emissions: 165 CO2 kg
Cereals are by far the most consumed product category in the world: this category includes gramineous family, usually harvested for dry grain. Their carbon footprint is very low, but their consumption in huge quantities contributes consistenlty to global emissions.
Australia, Denmark and Canada are among the major per capita producers.
Data below on per capita production are reported in kilograms.
Fibre Crops
- Annual per capita consumption: 4.30 kg
- Carbon footprint: 30.7 CO2 kg
- Total per capita emissions: 147 CO2 kg
This category is not strictly related to food, but is part of the agriculture sector: it includes vegetal fibres (such as cotton) used to produce thread and yarn that are manufactured into fabrics. Their relevant carbon footprint makes fibres play an important role in agriculture-related emissions.
Plantations in South America and Africa are relevant for historical reasons, but recently other countries are starting to produce relevant quantities of fibre crops.
Data below on per capita production are reported in kilograms.
In conclusion, you can see here the composition of total per capita emissions related to agriculture with respect to the different categories analysed above.

Note on Machine Learning algorithm: estimates for carbon footprint coefficients have been computed by fitting a Ridge Regression model over normalized data.